網站效能的監控,類似微軟的 application insights,但是微軟的要錢,自己架的不用,而且需要看甚麼就自己寫,換個方向想其實也比較方便
APM 的全名是 application performance management,而 RUM 則是 real user monitoring,RUM 直接從用戶端的瀏覽器崁入一些 js 指令收集數據,我自己的理解是 RUM 是類似 Chrome 開發者工具那樣,只是將數據保存在某個地方,便於之後查看,而 APM 則是將使用者的操作,後端的處理經過哪些指令,呼叫了那些第三方服務,這些等等的數據也記錄下來,然後可以透過一些視覺化的方式事後去監控網站前端與後端的效能。
對網站維運及除錯是蠻有幫助的…….只是 Log 的點要埋的對就是了,下面的步驟都只是初學的一些步驟及心得,不一定是正確的,參考請注意。
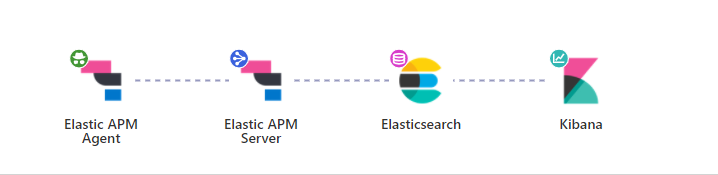
架構
架構如上,網頁加入apm-agent-rum-js ,傳遞給apm-server,再發送給elasticSearch,最後透過kibana觀看數據
環境建立 基本上就是透過 docker 建立所需要的東西,這部分請參考我自己練習的docker-compose ,當然我也是改自deviantony/docker-elk 的Elastic stack (ELK) on Docker,有興趣的人可以了解一下
apm-server 啟用 APM-server RUM 功能 APM-server 依賴elasticSearch,此處須設定 ES 的主機位置
1
2
3
4
5
6
7
8
9
10
11
12
apm-server.host: "localhost:8200" output.elasticsearch.hosts: ["http://elasticsearch:9200" ]apm-server.rum.enabled: true apm-server.rum.event_rate.limit: 300 apm-server.rum.event_rate.lru_size: 1000 apm-server.rum.allow_origins: ["*" ]apm-server.rum.library_pattern: "node_modules|bower_components|~" apm-server.rum.exclude_from_grouping: "^/webpack" apm-server.rum.source_mapping.cache.expiration: 5m apm-server.rum.source_mapping.index_pattern: "apm-*-sourcemap*"
設置 CORS 解決 CORS 及 APM 追蹤的問題,須加上 header,此處為了測試僅在web.config進行設置全部開放,實務上應針對個別的 API 進行設定
1 2 3 4 5 6 7 8 9 10 <system.webServer > <httpProtocol > <customHeaders > <add name ="Access-Control-Allow-Origin" value ="*" /> <add name ="Access-Control-Allow-Headers" value ="Content-Type, elastic-apm-traceparent" /> <add name ="Access-Control-Request-Method" value ="GET, OPTIONS, POST" /> <remove name ="X-Powered-By" /> </customHeaders > </httpProtocol > ...
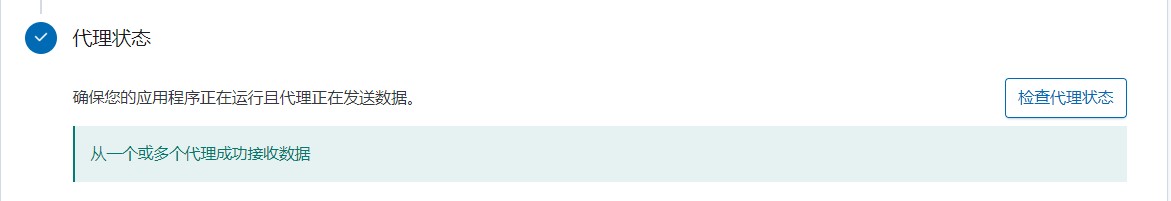
在後來自己的幾次練習,發現有的時候 APM-server 狀態都沒有正確,最後是將 container 全部 remove , 包含建立的 network 還有 elasticsearch 的 data,然後重新跑 docker-compose up,最後才出現了正確的狀態,之前也有嘗試過在 apm-server的容器內用 curl 去打 elasticsearch:9200 也是成功的,這個問題就始終查不到正確的解決方案…
apm-agent client 端範例 如果想看文件的話可以參考此處 ,取得 GitHub 或是 UNPKG 的 js 並於專案中引用載入,記得elastic-apm-rum.umd.js要先加入至專案
基本上只要在共用頁面_Layout.cshtml裡面埋這段 Code 就好了
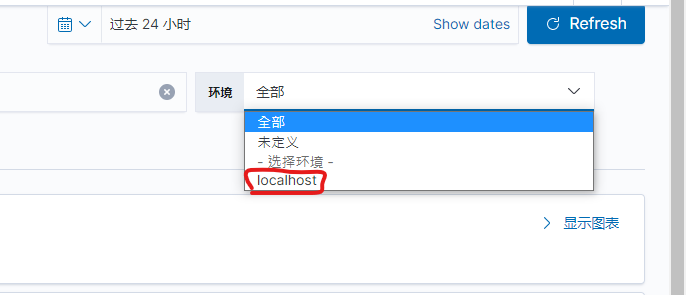
1
2
3
4
5
6
7
8
9
10
11
<script src="~/Scripts/Plugins/elastic-apm-rum.umd.js" crossorigin></script> <script > elasticApm.init ({ serviceName : 'mySite-FE' , serverUrl : 'http://localhost:8200' , active : true , instrument : true , disableInstrumentations :['eventtarget' ], environment : 'localhost' }) </script >
因為有設定environment,所以可以切換環境
文件請參考agent API ,以及init 設定
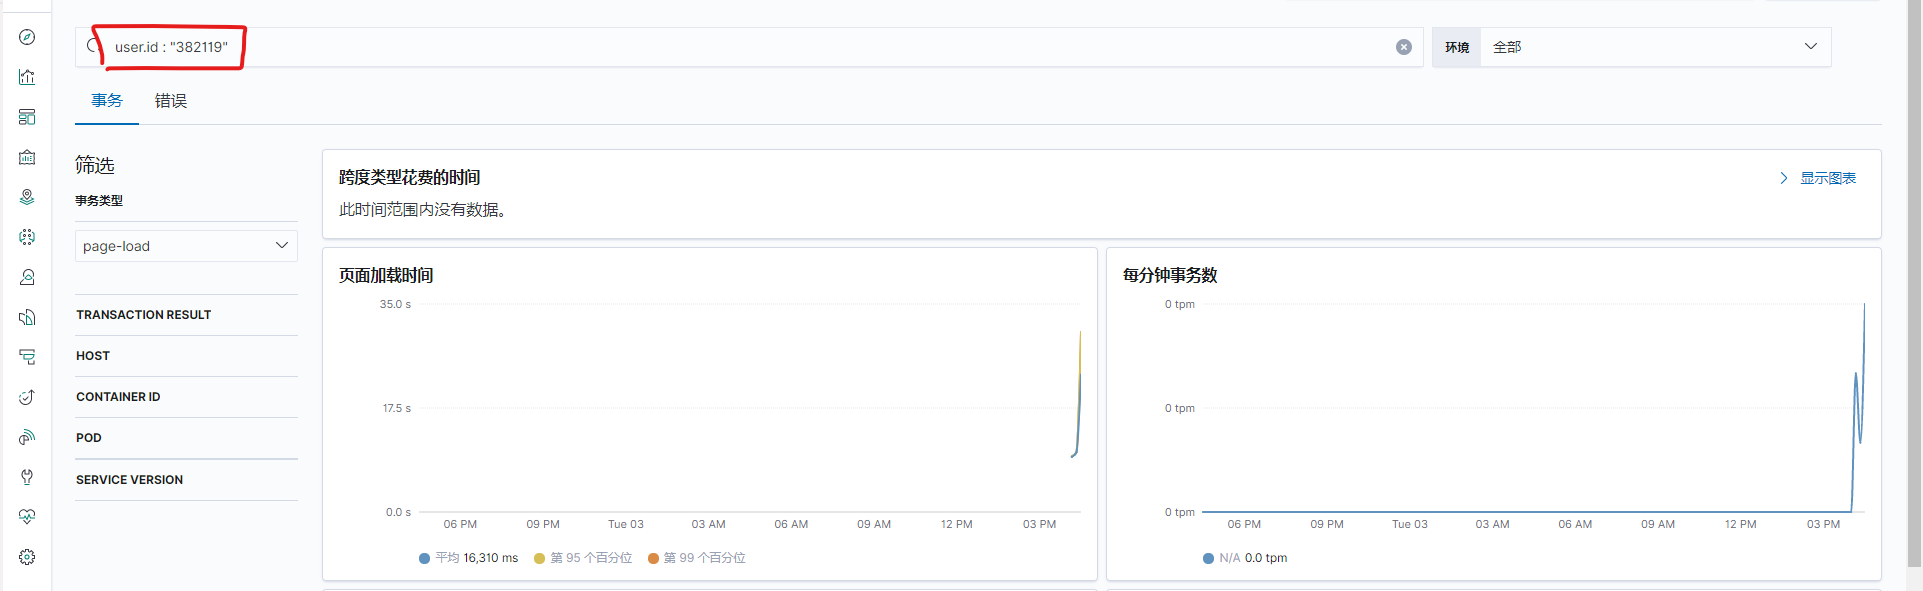
例如加入使用者資訊,就可以透過user.id : "382119"來篩選資料,或是透過user.name : "art"以人名篩選
1 2 3 4 elasticApm.setUserContext ({ id : @AuthorizeManagement .CurrentUser .Id , username : '@AuthorizeManagement.CurrentUser.Name' })
此處的AuthorizeManagement物件是後端自行設計的一個用來記錄登入者資訊的一個靜態類別,實際需要替換為你自己後端的資料來源
自行撰寫事件 如果套件自行建立的資料不符合需求,也可以選擇自己寫事件,下面是一個範例
1 2 3 4 5 6 7 8 9 10 11 12 13 14 15 16 17 18 19 20 21 22 23 24 25 26 27 28 29 30 31 32 33 34 35 36 37 38 39 40 41 42 43 44 45 46 47 48 49 50 51 52 53 54 55 <h2 > 會員資料異動模擬</h2 > <div id ="app" > <form > <label for ="phone" > 電話</label > <input type ="text" v-model ="form.phone" /> <label for ="name" > 姓名</label > <input type ="text" v-model ="form.name" /> </form > <button @@click ="insAuditLog" > 修改</button > <button @@click ="getAuditLog" > refresh</button > <span > 共 {{ recordCount }} 筆異動紀錄</span > <table class ="table table-bordered table-sm" > <thead > <tr > <th > #</th > <th > 異動紀錄</th > </tr > </thead > <tbody > <tr v-for ="(record,index) in records" > <td > {{ index + 1}}</td > <td > <table class ="table table-bordered table-sm" > <thead > <tr > <th > #</th > <th > 異動欄位</th > <th > 異動前</th > <th > 異動後</th > <th > 異動日期</th > <th > 異動人員</th > </tr > </thead > <tbody > <tr v-for ="(content,index) in record._source.content" > <td > {{ index+1 }}</td > <td > {{ content.field }}</td > <td > {{ content.valueBefore }}</td > <td > {{ content.valueAfter }}</td > <td > {{ record._source.modifiedDate }}</td > <td > {{ record._source.modifiedBy }}</td > </tr > </tbody > </table > </td > </tr > </tbody > </table > </div > @section scripts{ <script src ="~/Scripts/Page/AuditLog/Index.js" > </script > }
基本上就是在初始化的時候宣告pageLoadSampled,跟 server 說我要自己定義事件了,你不用幫我用預設的事件了,所以後續就自行撰寫startTransaction()還有startSpan()了,這個部份我沒有太深入研究,暫時對我來說基本的夠用了
1
2
3
4
5
6
7
8
9
10
11
12
13
14
15
16
17
18
19
20
21
22
23
24
25
26
27
28
29
30
31
32
33
34
35
36
37
38
39
40
41
42
43
44
45
46
47
48
49
50
51
52
53
54
55
56
57
58
59
60
61
62
63
64
65
66
67
const SERVER_URL = "http://localhost:8898/" ;const vm = new Vue ({ el : "#app" , data : { records : null , form : { phone : null , name : null , }, }, mounted ( elasticApm.init ({ serviceName : "mySite-FE" , serverUrl : "http://localhost:8200" , pageLoadSampled : true , }); this .getAuditLog (); }, methods : { checkForm ( for (const key in this .form ) { if (this .form .hasOwnProperty (key)) { const element = this .form [key]; if (element) return true ; } } return false ; }, getAuditLog ( var transaction = elasticApm.startTransaction ("取得資料" , "custom" ); var httpSpan = transaction.startSpan ("取得異動紀錄" , "http" ); var vm = this ; $.ajax ({ url : "/AuditLog/GetFakeData" , }).done (function (res ) { if (res.hits && res.hits .hits ) vm.records = res.hits .hits ; httpSpan.end (); if (transaction) transaction.end (); }); }, insAuditLog ( var transaction = elasticApm.startTransaction ("異動資料" , "custom" ); if (this .checkForm () === false ) { console .log ("plz input data in form" ); return ; } var httpSpan = transaction.startSpan ("新增異動紀錄" , "http" ); var vm = this ; $.ajax ({ url : "/AuditLog/InsFakeData" , data : { ...vm.form }, type : "POST" , }).done (function (res ) { console .log (res); httpSpan.end (); if (transaction) transaction.end (); }); }, }, computed : { recordCount ( return this .records ? this .records .length : 0 ; }, }, });
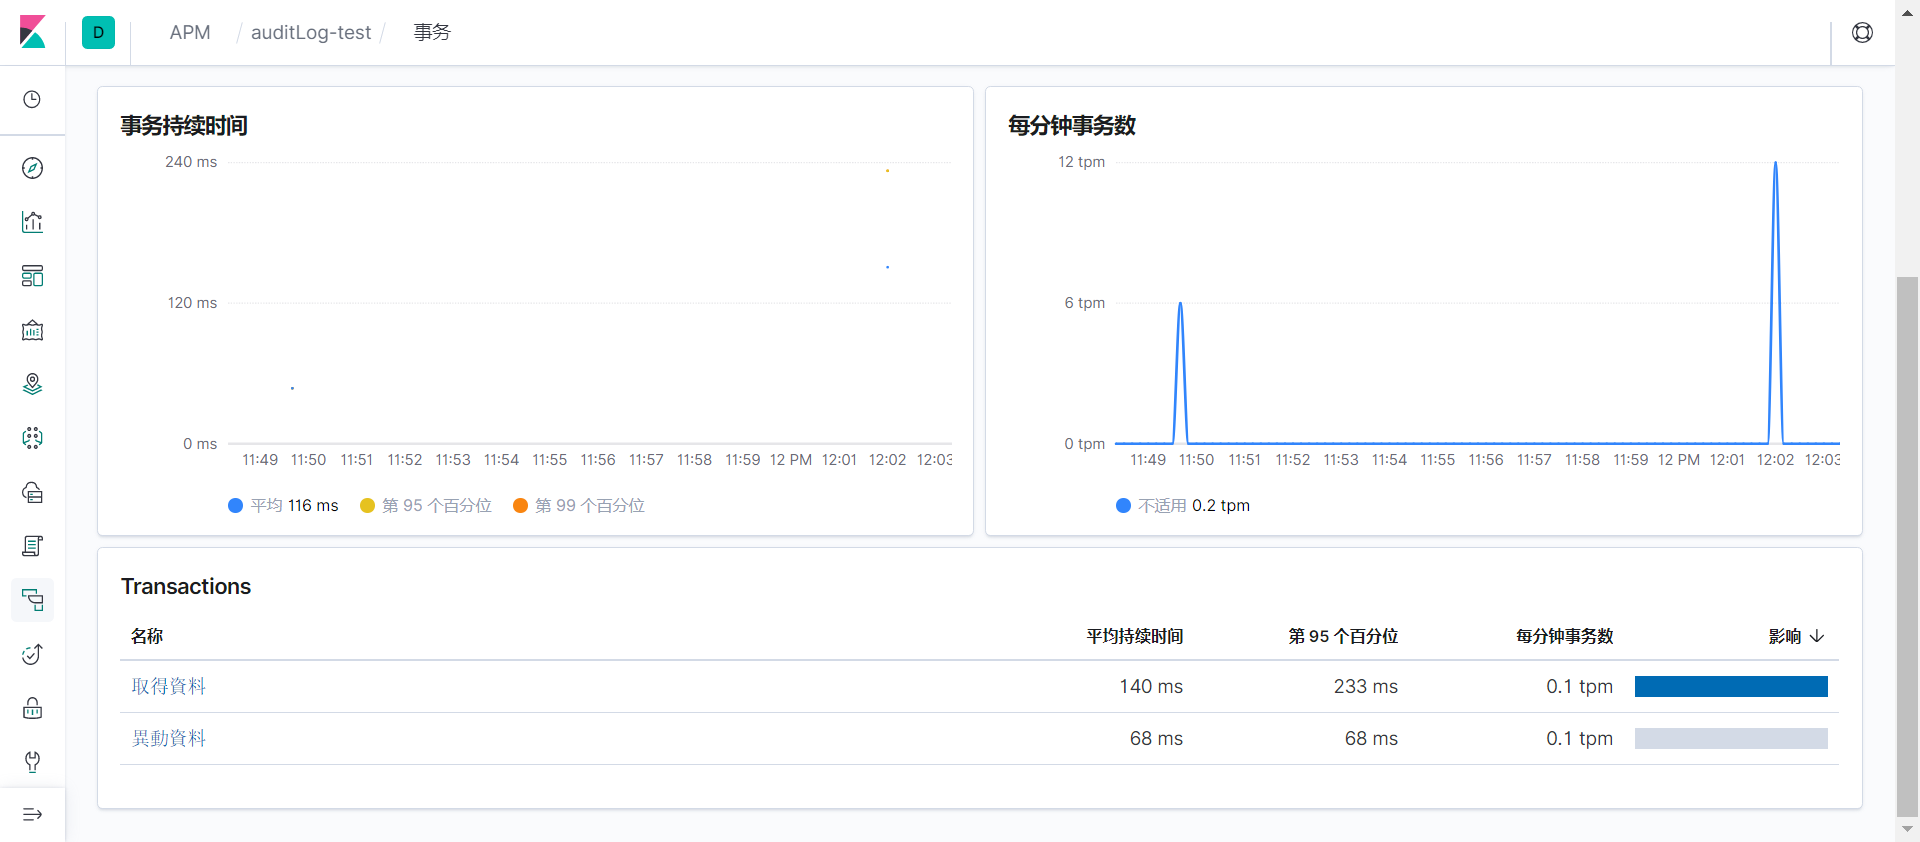
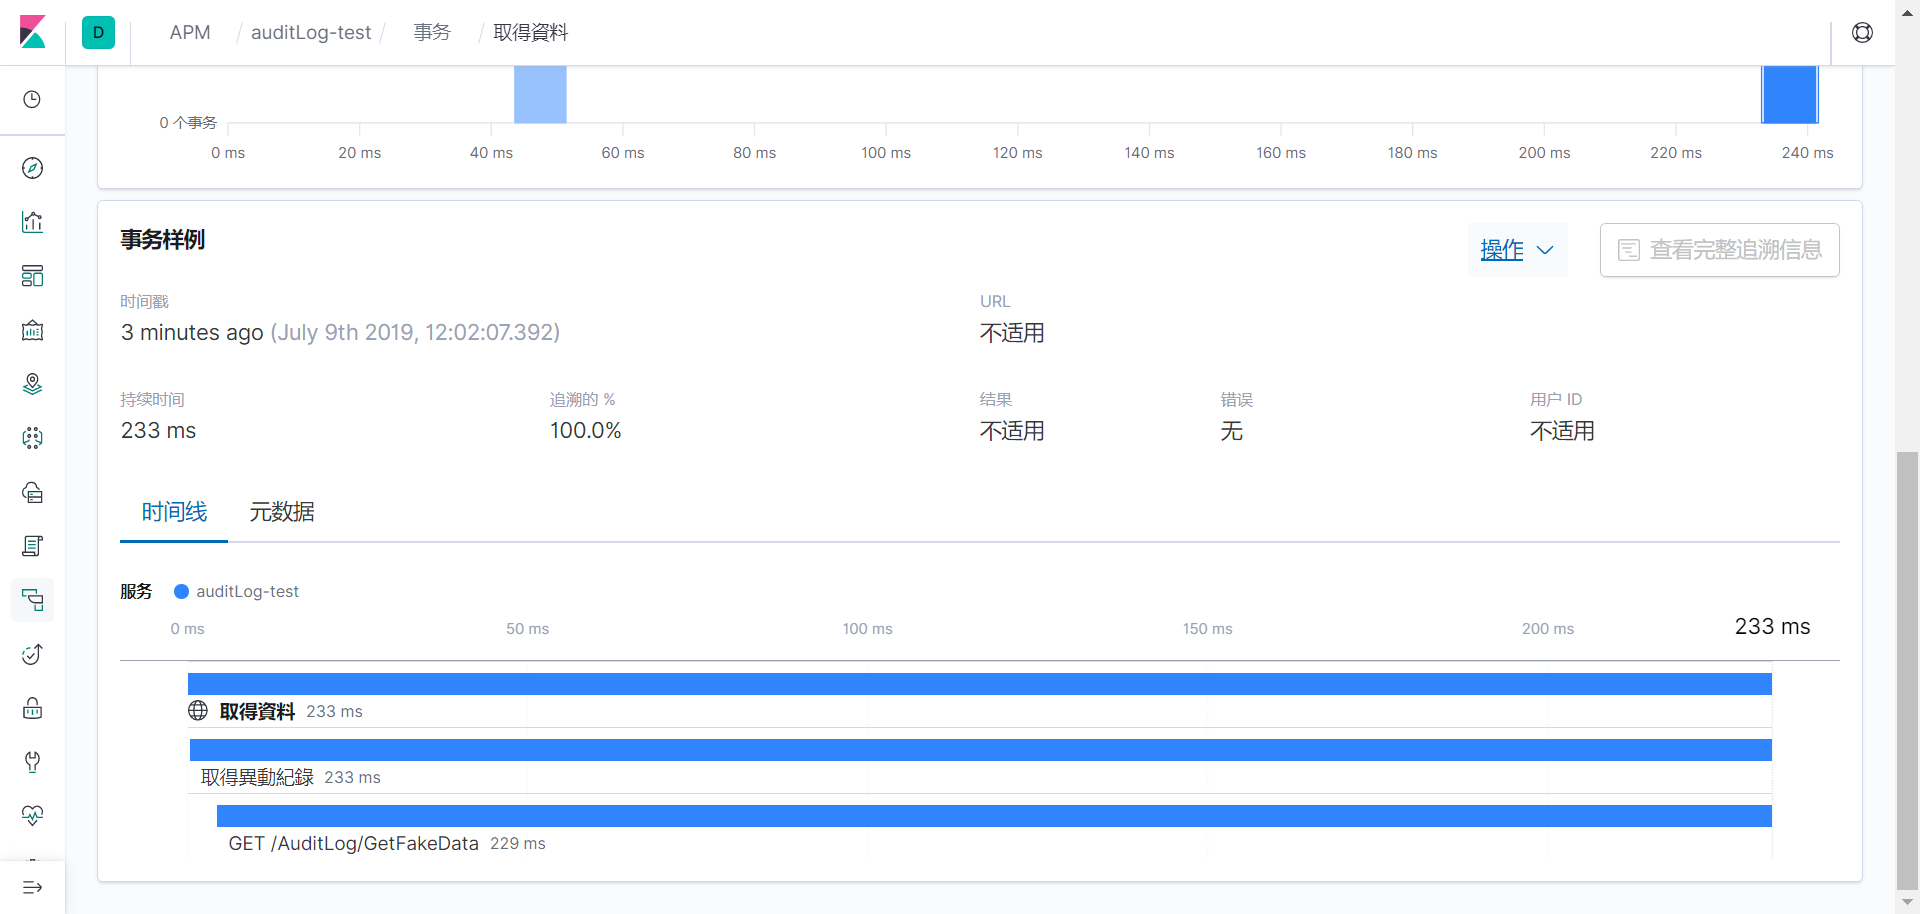
Kibana - APM 大概結果就像是這樣,自訂的事件已經會被記錄下來
apm-agent (webpack) 如果是透過 webpack 打包程式,在程式內要引用 apm-agent 的話則是先透過指令安裝套件
1 npm install @elastic/apm-rum --save
然後在程式內引用即可,目前我自己的作法是建立一個 singleton 去初始化,然後再有需要用到的地方再去呼叫
1
2
3
4
5
6
7
8
9
10
11
12
13
14
15
16
17
18
19
20
21
22
23
24
25
26
27
28
29
30
31
32
33
34
import { init as initApm } from "@elastic/apm-rum" ;let instance = null ;class ApmHelper { constructor (user ) { if (!instance) { instance = initApm ({ serviceName : "my-site" , environment : "localhost" , active : true , instrument : true , disableInstrumentations : ["eventtarget" ], }); } if (user) { instance.setUserContext ({ id : user.Id , username : user.Name , }); } return instance; } } export default ApmHelper ;
在進入點的時候,我先初始化 apm
1 2 3 4 5 6 7 new Vue ({ mounted ( new ApmHelper ({ Id : "001" , Name : "Art" }); }, });
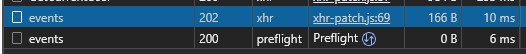
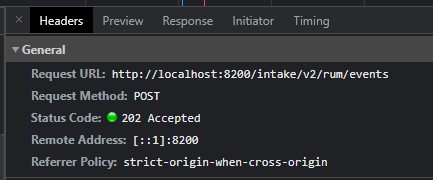
此時若進入該頁面,會看到背景發出了一個事件出去
可以看到他打的是我們 apm-server,所以我們稍後也可以在kibana看到資訊
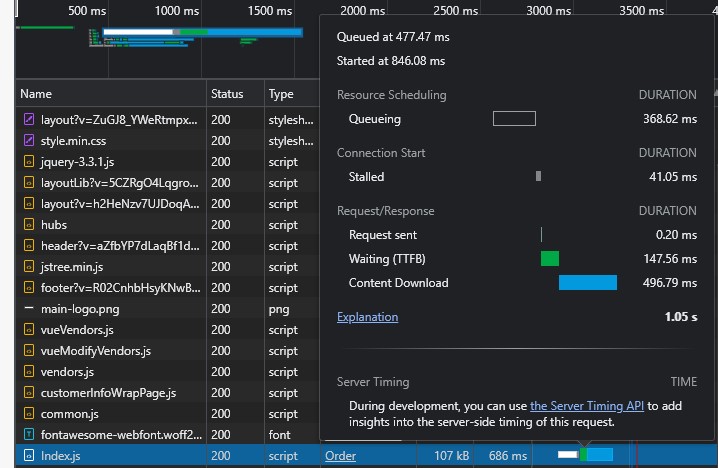
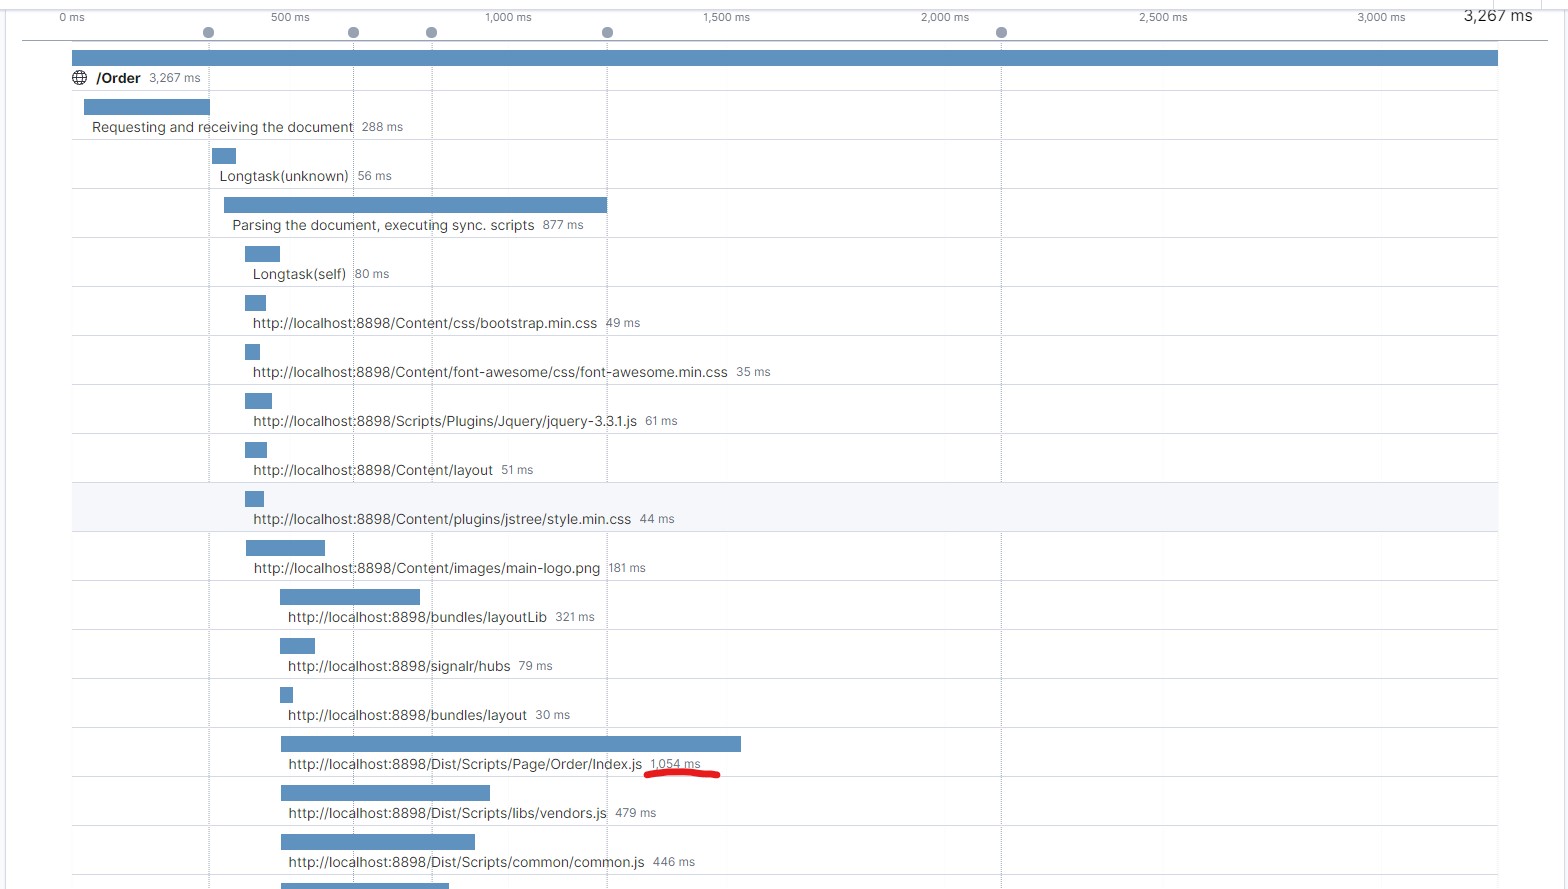
此時我們 F12 來看一下 index.js 讀取花了 1.05 秒,而 APM 這邊也有正確記錄下來
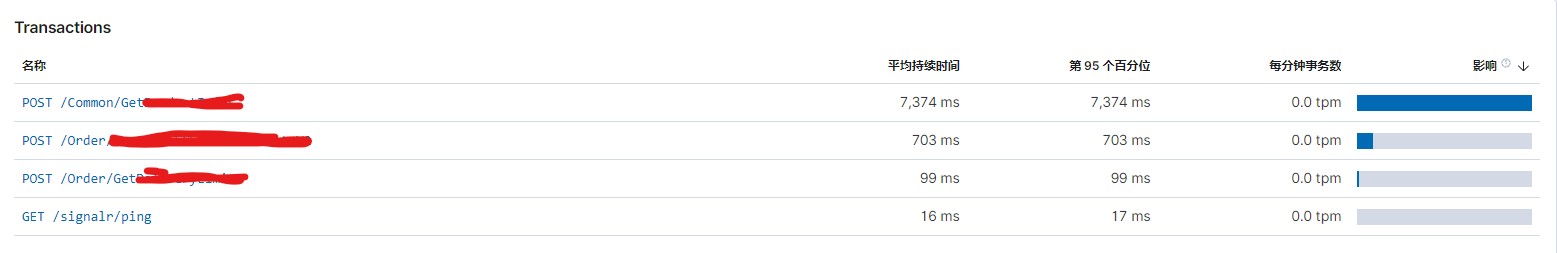
另外,我也在網站上隨便測了幾個會發出 http request 的事件,接著回到kibana去觀察,可以看到剛剛測試的事件數據
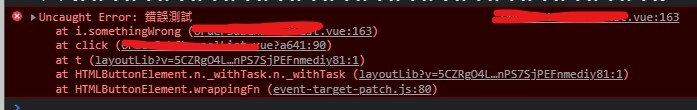
在其他的元件內,做一個假的按鈕,點了之後就呼叫 APM 附加我們要記錄下來的資料,然後故意丟一個 ERROR,讓 APM 紀錄資訊
1 <button @click ="somethingWrong" > GetWrong</button >
1
2
3
4
5
6
7
8
9
10
11
new Vue ({ methods : { somethingWrong ( let apm = new ApmHelper (); let fakeData = { orderId : 12345 , productId : 67890 }; apm.setCustomContext (fakeData); throw new Error ("錯誤測試" ); }, }, });
在錯誤測試的部分,可以看到 F12 的情況像是這樣
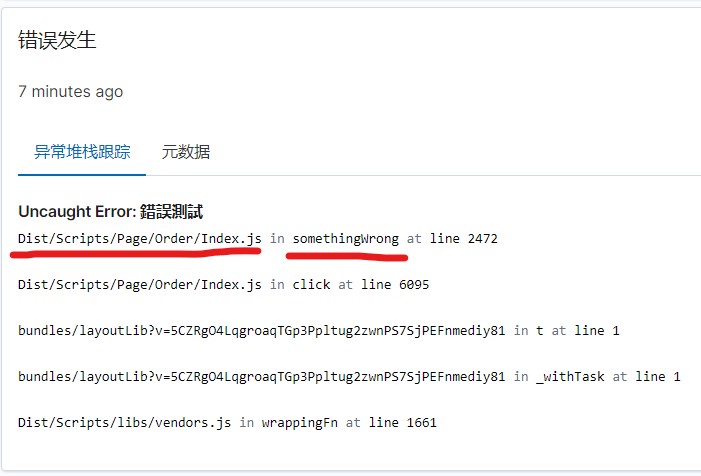
點進去看之後,我覺得比較有參考價值的就是最後一行,是哪一隻檔案的哪一個 function 錯誤
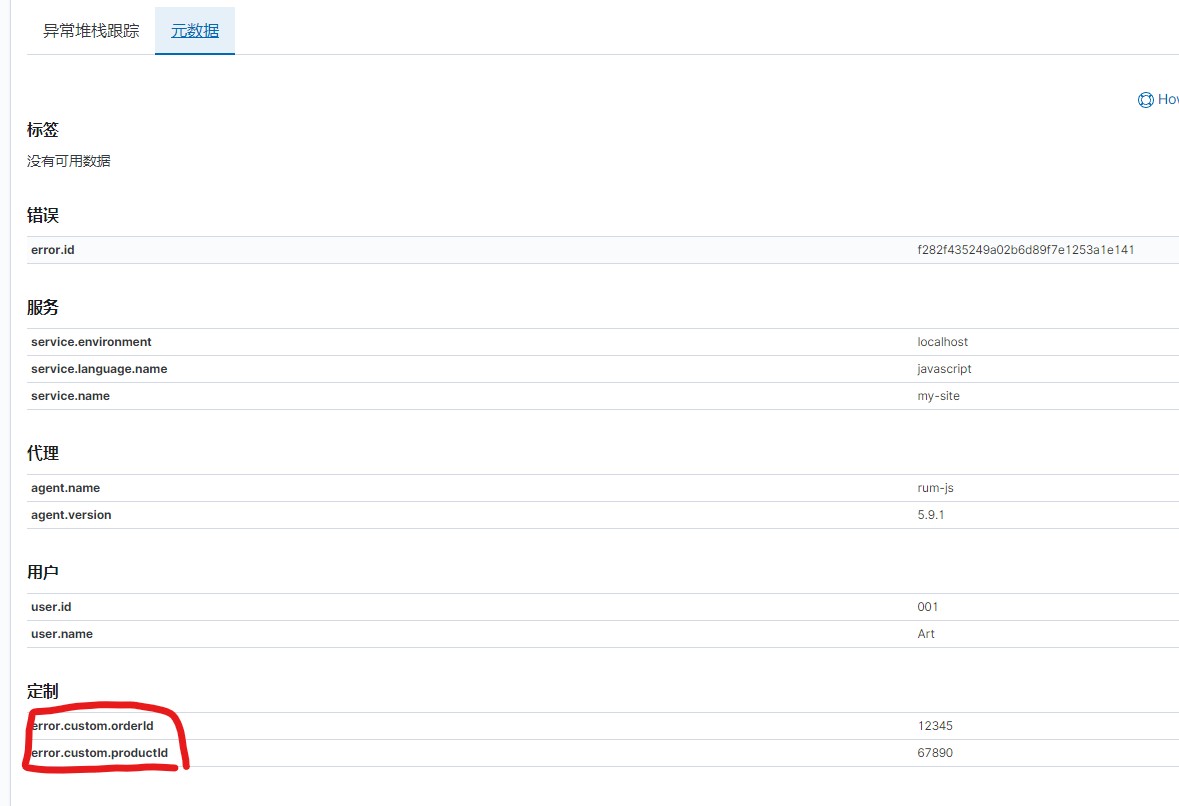
選擇另外一個頁籤,可以看到我們透過setCustomContext()附加上去的假資料
小結
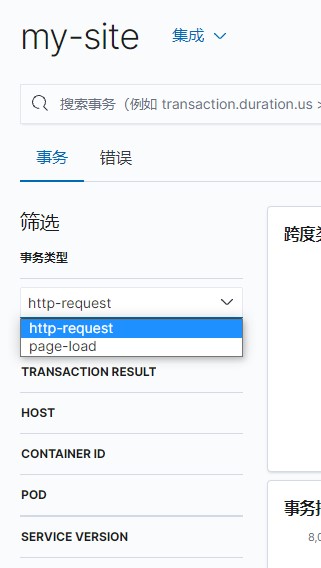
在整個網站會共用的地方,透過上面的程式做初始化,這樣在每一個頁面至少都能夠抓到page-load還有http-request的數據
在比較重要的地方,可以再透過setCustomContext()的方式去附加一些重要資訊
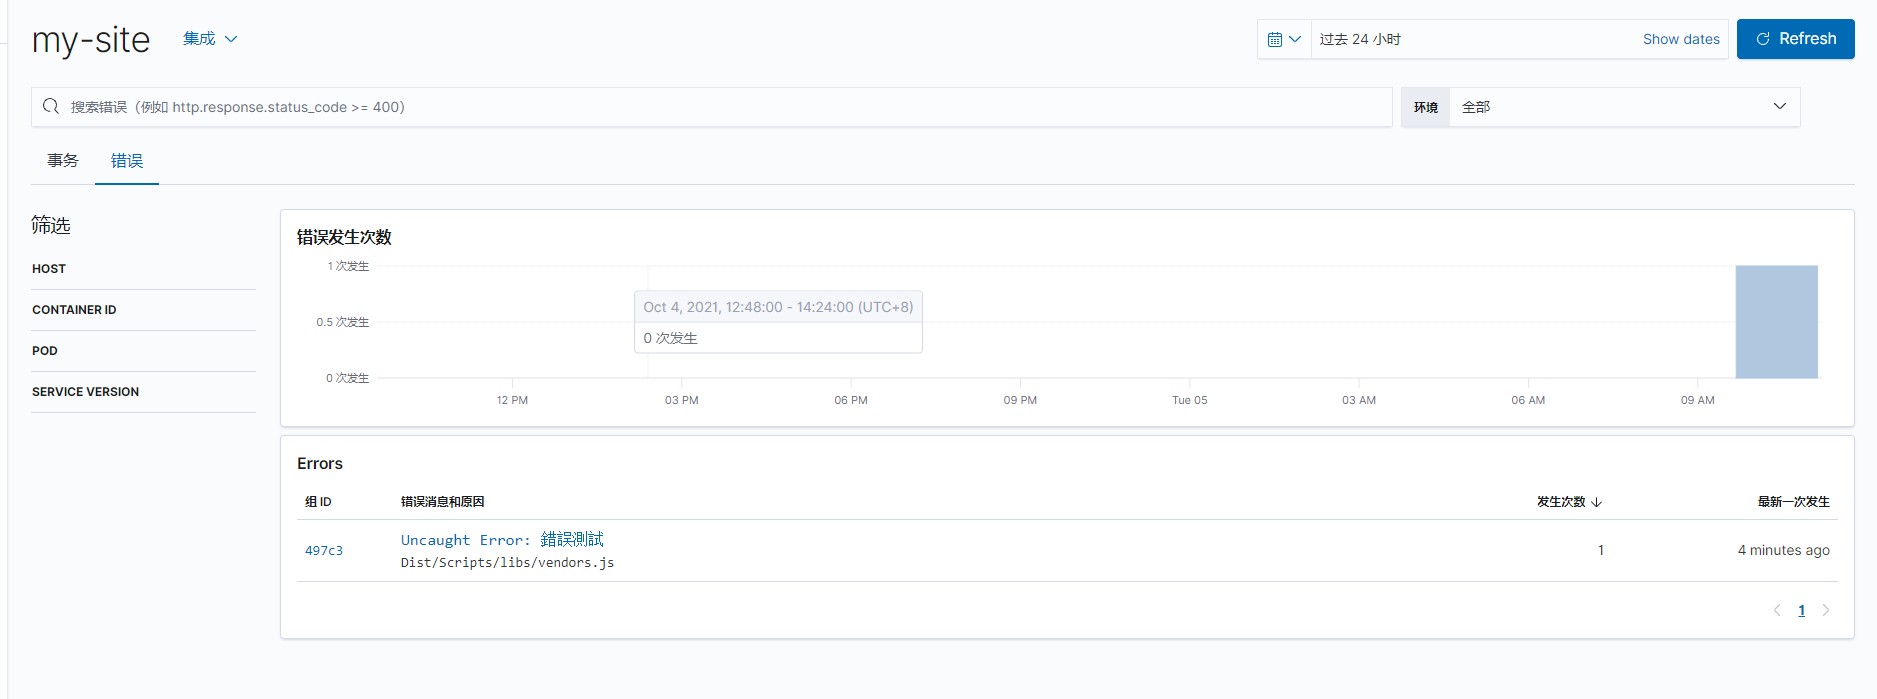
前端爆掉throw Error的話,至少可以在kibana能夠看到數據,就可以趕緊針對性的處理了
參考連結
APM Real User Monitoring JavaScript Agent Reference Custom Transaction Transaction API